The Real Growth Story Isn’t Mumbai or Bangalore Anymore: What India’s Tier-2 & Tier-3 Commerce Boom Means for Business Owners

Part 1 of 3 in the India Commerce Market Intelligence series from Horeb eCommerce.
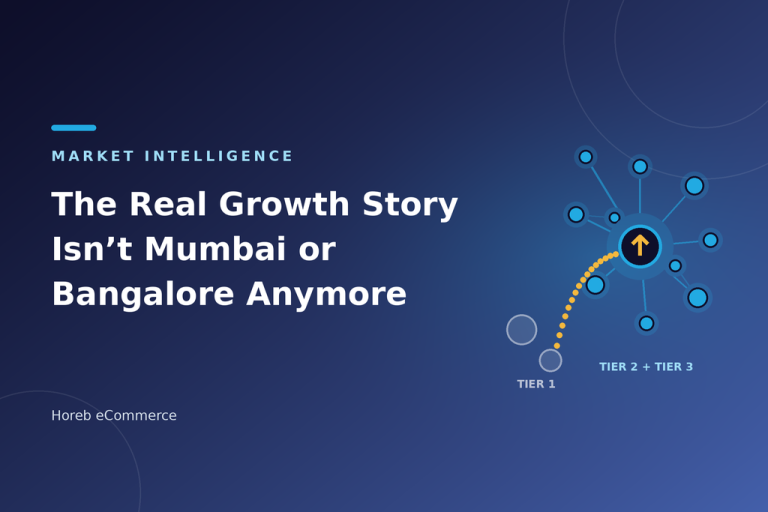
For most of the last decade, Indian ecommerce strategy had a simple geography: win Delhi NCR, Mumbai and Bengaluru first, then “expand.” The data now says that sequence is backwards. Across several independent datasets, the largest share of new online orders no longer starts in the metros. It starts in cities most boardroom maps still label as “other.”
This article sets out what the numbers show, where they mislead, what smaller-city shoppers actually need, and what business owners should change in the next two quarters. It is written for founders, retail operators and investors who make decisions with limited budgets, not for analysts who need another trend line.
Horeb eCommerce
Is your growth plan still metro-first?
Share your current order data by pincode and we’ll show you where your next profitable customers are likely to come from.
WhatsApp +91 62824 72767WhatsApp +91 97875 72767[email protected]What the Data Says, and What It Doesn’t
No single report settles this, so it is worth looking at several. They use different definitions of “tier,” different platforms and different time windows, so treat them as a pattern, not a precise measurement.
| Source | What it found | Scope |
|---|---|---|
| Unicommerce | Nearly 66% of new D2C orders in FY26 came from Tier-2 and Tier-3 cities, with those cities contributing about 60% of incremental GMV | Brand-website D2C orders processed on its platform |
| ClickPost | Tier-2 and Tier-3 cities accounted for about 74.7% of online orders over Diwali 2025 (Tier-3 alone 50.7%) | About 42.5 million shipments |
| Flipkart | More than 60% of orders come from Tier-2 and Tier-3 regions | Company statement, marketplace |
| LS Digital | Tier-2 and Tier-3 markets drove 65% of festive orders | 1.5 million orders, 30+ enterprise brands |
| Fynd | Tier-2 and Tier-3 together contributed more than 60% of orders in the Republic Day 2026 sale | Marketplace sale-period orders |
Three nuances matter for decisions.
- Share is not growth. In the opening phase of the 2026 festive season, ClickPost recorded Tier-3 cities at 45% of D2C shipments, yet shipment growth was faster in Tier-1 cities (37% year on year) than in Tier-3 (34%) or Tier-2 (27%). Smaller cities are the biggest slice of volume, not necessarily the fastest-moving one every quarter.
- Orders are not value. Unicommerce’s 66% of new orders translated into roughly 60% of incremental GMV. That gap suggests slightly smaller tickets, which changes the unit economics.
- Sale periods exaggerate. Festive and sale-day data over-represents bargain-driven, first-time buyers. Check whether your own year-round data shows the same pattern.
Quick Commerce Just Validated the Shift
The clearest signal comes from companies that spend heavily on location data. Brokerage Bernstein estimates that Blinkit, Instamart, Zepto, Flipkart Minutes and Amazon Now now operate roughly 6,500 dark stores between them, with about 900 added in a single quarter, and that around 75% of Blinkit’s latest additions were outside the metros.
Flipkart Minutes, which launched only in August 2024, now runs nearly 1,200 stores across more than 150 cities and says its Tier-2-and-below customer base grew nearly 25 times in the year to September 2026. Its logic is visible in the numbers: in Delhi NCR about 34% of urban households order from a quick commerce app at least once a month, while in the average Tier-2 city the figure is around 6%. Emkay estimates a Tier-2 dark store needs roughly 800 orders a day to break even, against about 1,300 in a metro, because rents, labour and store sizes are lower.
Read that carefully. It does not say small-city quick commerce is proven. Blinkit does not report small-city profitability separately, and these stores take time to mature. It does say the largest platforms believe metro densification has diminishing returns and that the next demand pool sits elsewhere. If you run a local retail or grocery business, this is both a threat and an opening. Our guide to launching a quick commerce app from a single grocery store and the WooCommerce route for budget-conscious local delivery show how smaller operators can respond without copying a national network.
What Smaller-City Shoppers Actually Need
“Tier-2 and Tier-3” is not one customer. But several patterns recur in logistics and payments data, and they decide whether a growth push makes money or burns it.
- Trust before conversion. Even where UPI is widely used, a trust gap with online brands persists in smaller towns, and many first purchases are cash on delivery (COD), with repeat orders shifting to prepaid as confidence builds.
- Flexible payment. One logistics report puts prepaid adoption at 46% in metros, 40% in Tier-2 (the fastest-growing) and 34.5% in Tier-3. COD is shrinking as a share, but it has not disappeared.
- Language and clarity. Regional-language content, simple product pages and WhatsApp-based support reduce hesitation more than discounts do.
- Faster delivery than you planned for. Brands built around 4–5 day delivery are now compared with a baseline of one to two days across geographies, not just in metros.
- Different baskets. Unicommerce’s Republic Day data showed Tier-3 cities at about 43% of food and beverage orders, and healthy-food volumes more than doubling in Tier-2 cities. Your assortment should follow local demand, not metro bestsellers.
The Economics Most Owners Miss
The expensive part of small-city growth is rarely acquisition. It is the cost of an order that goes wrong. Industry figures put return-to-origin (RTO) rates for COD orders at roughly 25–30% in India, against 2–3% for prepaid orders. Add fragmented courier coverage, address-quality problems and longer last-mile times in some pincodes, and the same ad spend produces very different margins by city.
An illustrative example. Assume ₹800 average order value and ₹60 per shipping leg. Out of 100 COD orders at a 27% RTO rate, 27 orders cost about ₹120 each in wasted forward and reverse shipping, roughly ₹3,240, plus blocked stock and handling. The same 100 prepaid orders at a 3% RTO rate waste about ₹360. Neither number includes lost margin on discounts or customer-service time. Replace the assumptions with your own, but run the calculation by pincode, not by national average.
Killing COD is not the answer either. One industry estimate suggests removing it entirely would cost many D2C brands a large share of their volume. The goal is to shape the funnel: verify orders, incentivise prepaid, and route risky pincodes differently.
A Six-Move Playbook for Business Owners
- 1. Build a pincode demand map. Segment your last 12 months of orders, ad clicks and search impressions by pincode and tier. Look at order value, RTO and repeat rate, not only volume.
- 2. Redesign payments. UPI-first checkout, COD with OTP or WhatsApp verification, a prepaid incentive, and partial-advance COD for high-risk categories.
- 3. Choose couriers by pincode. Apply rule-based carrier selection and serviceability checks so you stop shipping into pincodes where you lose money.
- 4. Localise trust. Regional-language product content, real reviews, clear return terms and WhatsApp order updates.
- 5. Place stock closer to demand. Regional inventory, store-based fulfilment or a micro-fulfilment pilot in one dense town before scaling. See how Magento handles multi-source inventory and what Shopify Plus can and can’t do for fast delivery when you add locations.
- 6. Make the platform mobile-first and API-ready. Fast on mid-range phones and patchy 4G, easy to connect to marketplaces, couriers, payment gateways and quick commerce partners.
Horeb eCommerce
Need this playbook turned into a build plan?
We design and build storefronts, checkout, courier and inventory integrations on Magento, Shopify and WooCommerce for Tier-2 and Tier-3 growth.
WhatsApp +91 62824 72767WhatsApp +91 97875 72767[email protected]What It Means for Your Type of Business
| If you are… | The opportunity | The watch-out | First move |
|---|---|---|---|
| A local retailer or grocer | Under-served towns with rising online habits and early quick commerce interest | Marketplaces and quick commerce giants arriving with deeper pockets | Launch a narrow, reliable delivery radius from your best store |
| A metro-based D2C brand | Most new orders and incremental volume are outside your home market | Higher RTO and COD risk can erase the margin you expect | Pilot 20–30 high-potential pincodes with tighter payment and courier rules |
| A marketplace or multi-vendor operator | Seller supply and buyer demand are both growing in smaller cities | Quality, logistics and trust vary widely by town | Invest in seller onboarding and pincode-level service standards |
| An investor | A larger addressable base and rising digital adoption | Smaller tickets, unproven small-city quick commerce economics | Ask operators for unit economics by tier, not blended averages |
What the Data Can’t Tell You
- Most figures come from platforms with their own customer mix, so no dataset represents all of Indian commerce.
- Tier definitions differ, and a “Tier-3 city” in one report may not match another.
- Rapid growth from a small base looks dramatic; a “42x” increase is not the same as a mature market.
- Aggregate trends say little about your category. A jeweller, a fertiliser dealer and a snack brand face different realities in the same town.
Treat the macro story as a reason to test, not a reason to bet the company.
Conclusion
The metro-first assumption has not disappeared, but it no longer describes where most new orders begin. The owners who benefit will not be the ones who simply advertise in more cities. They will be the ones who rebuild payments, logistics, language and platform foundations so that a Tier-3 order is as profitable as a Tier-1 order.
In the next article in this series, The Next Digital Divide: AI-Powered Retailers vs Everyone Else, we look at how data and automation will separate the businesses that handle this complexity well from those that don’t. For the quick commerce angle in the meantime, see how AI is reshaping forecasting and fulfilment.
Horeb eCommerce
Ready to plan your Tier-2 and Tier-3 growth?
Book a free 30-minute consultation with Horeb eCommerce and leave with a prioritised, pincode-aware roadmap.
WhatsApp +91 62824 72767WhatsApp +91 97875 72767[email protected]Frequently Asked Questions
What share of India’s online orders come from Tier-2 and Tier-3 cities?
Several 2025–26 datasets put the figure above 60%, with variation by platform and period. Unicommerce found roughly 66% of new D2C orders in FY26 came from these cities, and ClickPost recorded about 74.7% of Diwali 2025 orders.
Why are Tier-2 and Tier-3 cities growing so fast in ecommerce?
Wider smartphone and internet access, UPI payments, better courier reach, regional-language content and the arrival of fast-delivery services have lowered the barriers to buying online.
Is cash on delivery still necessary for Tier-2 and Tier-3 customers?
For most brands, yes, at least for first purchases. The practical approach is to keep COD but add order verification, prepaid incentives and pincode-based risk rules, because COD RTO rates are far higher than prepaid.
Can quick commerce work in smaller Indian cities?
Early signs are strong, with major platforms expanding there and analysts estimating lower break-even order counts per store. But small-city profitability is not yet widely reported, so treat it as promising, not proven.
What should a metro-based brand change first to sell in smaller cities?
Start with payments and logistics: pincode-level courier selection, COD verification and prepaid incentives. Then localise content and trust signals.
How do I know if my business should target smaller cities?
Analyse your own orders and ad data by pincode for demand, order value, RTO and repeat rate. Pilot a small set of pincodes before committing budget.
Sources and notes: figures are drawn from 2025–26 reports and company statements by Unicommerce, ClickPost, Flipkart, LS Digital, Fynd, Bernstein, Emkay and others, as reported in business press. Definitions of city tiers differ by source. The RTO example uses illustrative assumptions, not Horeb data.